Overview
As Dollywood and Silver Dollar City prepared for major growth, leadership needed a clear view of how their parks were performing at a systems level. The core question was:
"Do our attractions provide the capacity required for our attendance today, and the attendance we expect tomorrow?"
I was responsible for turning seasonal operations data into a strategic tool that would guide the parks' next major investments.
My Contribution
Automated the data-import process. Partnered with a programming consultant to replace a slow, manual input workflow with a scraping tool. A process that previously took months now completed in under a day.
Built dashboards showing hourly and seasonal throughput, downtime patterns, dispatch efficiency, and bottleneck attractions across the full operating year.
Identified underperforming attractions and created attendance-based forecasting models that informed decisions on new hotels, land expansions, and high-capacity attractions.
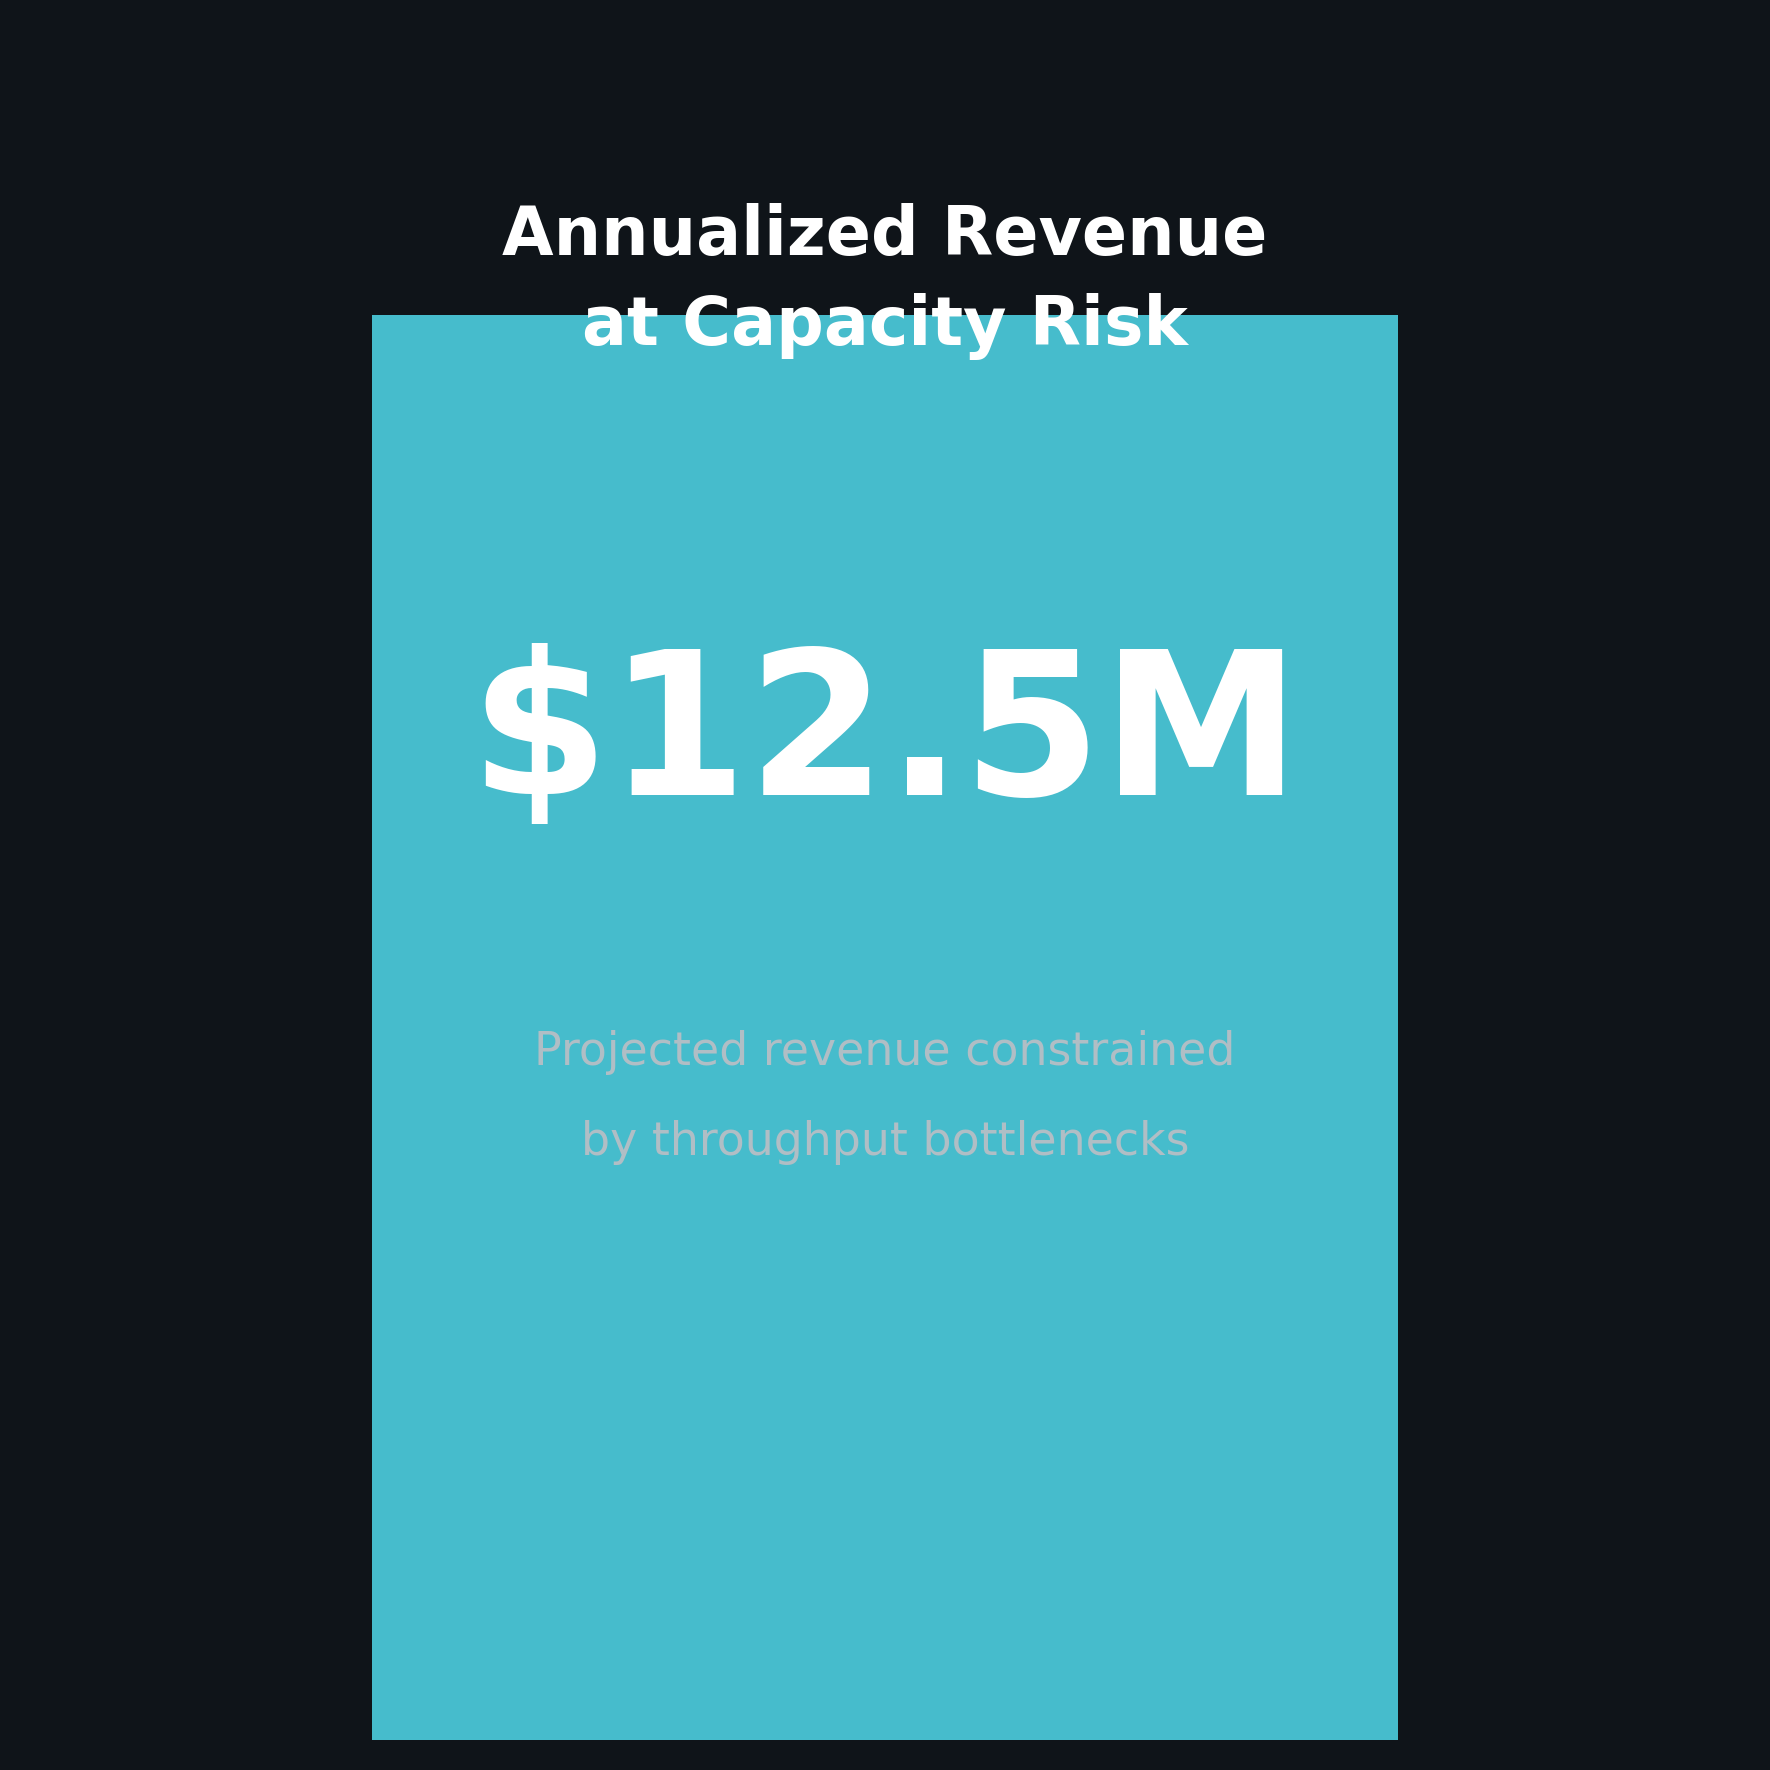
Revenue Risk Assessment
Analyzed attraction financial performance to identify revenue at risk from underperforming assets. This analysis helped leadership understand which attractions were creating bottlenecks and which should be prioritized for replacement or enhancement.
The dashboards showed hourly and seasonal throughput, downtime patterns, and dispatch efficiency metrics across the full operating year.

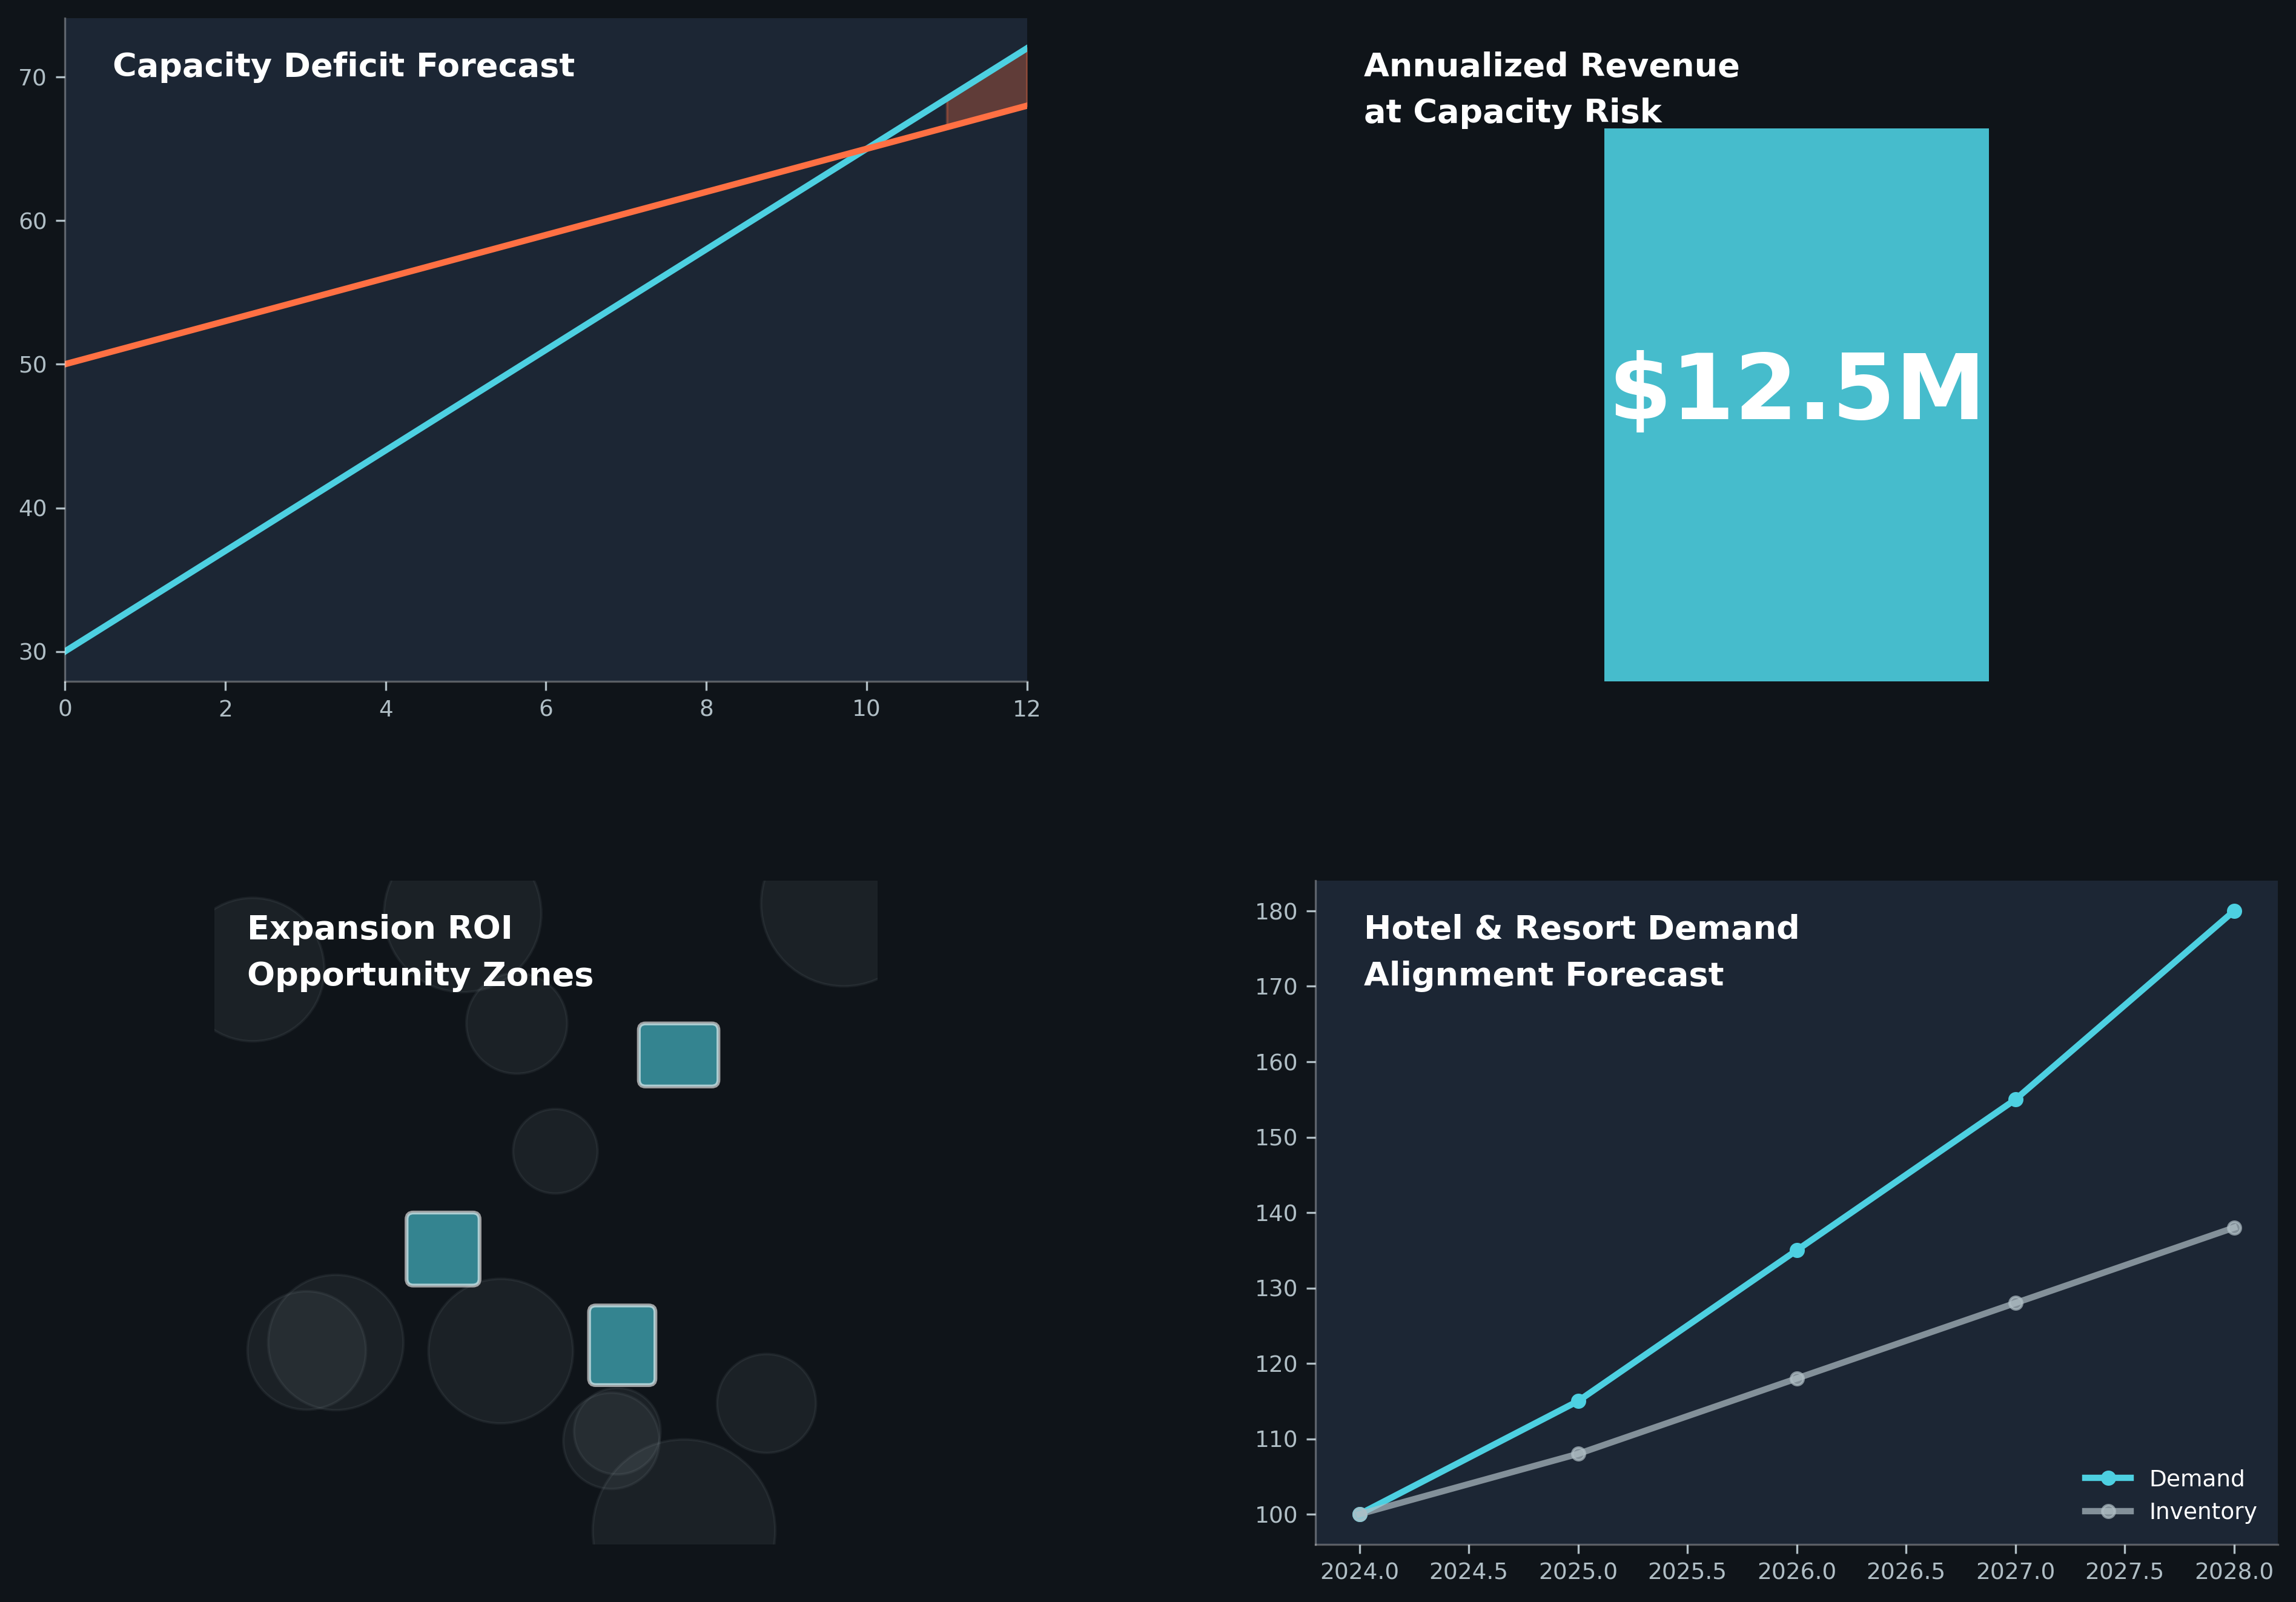
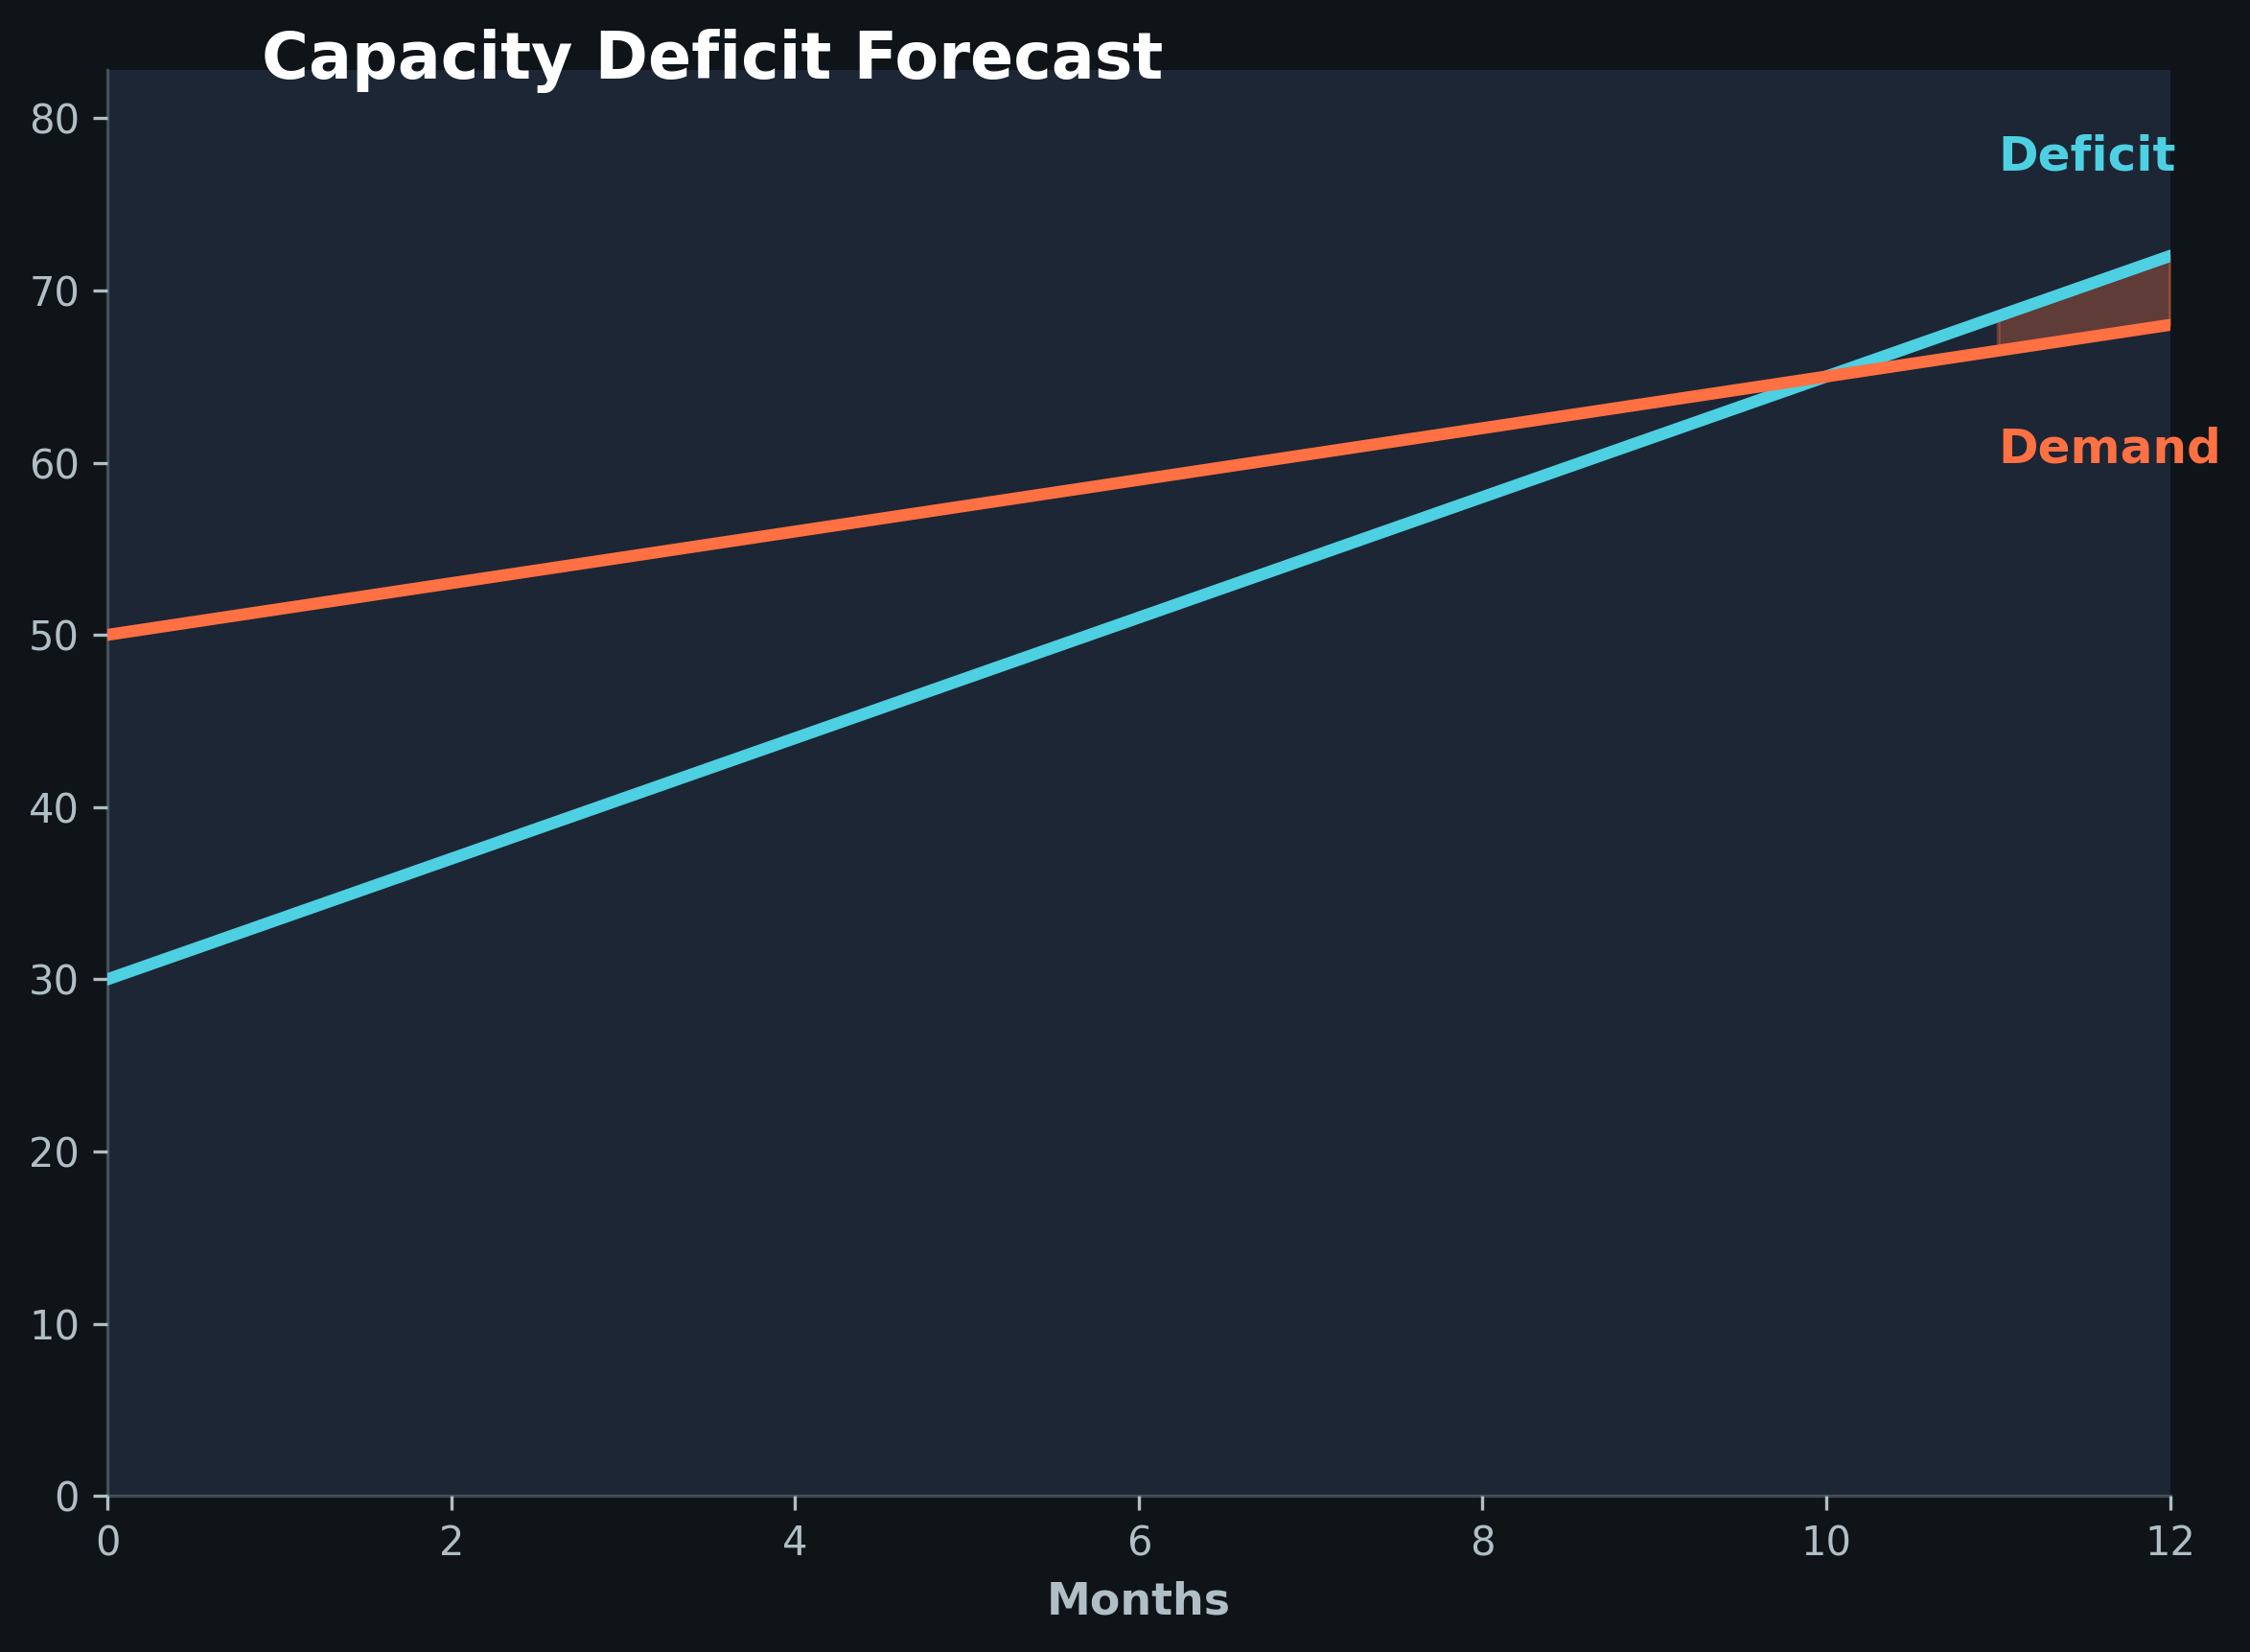
Demand Forecasting
Created attendance-based forecasting models that mapped capacity constraints against projected growth. This helped identify when and where the parks would need to expand to meet future demand.
The models informed a five-year capital strategy that prioritized investments based on both guest experience needs and business objectives.
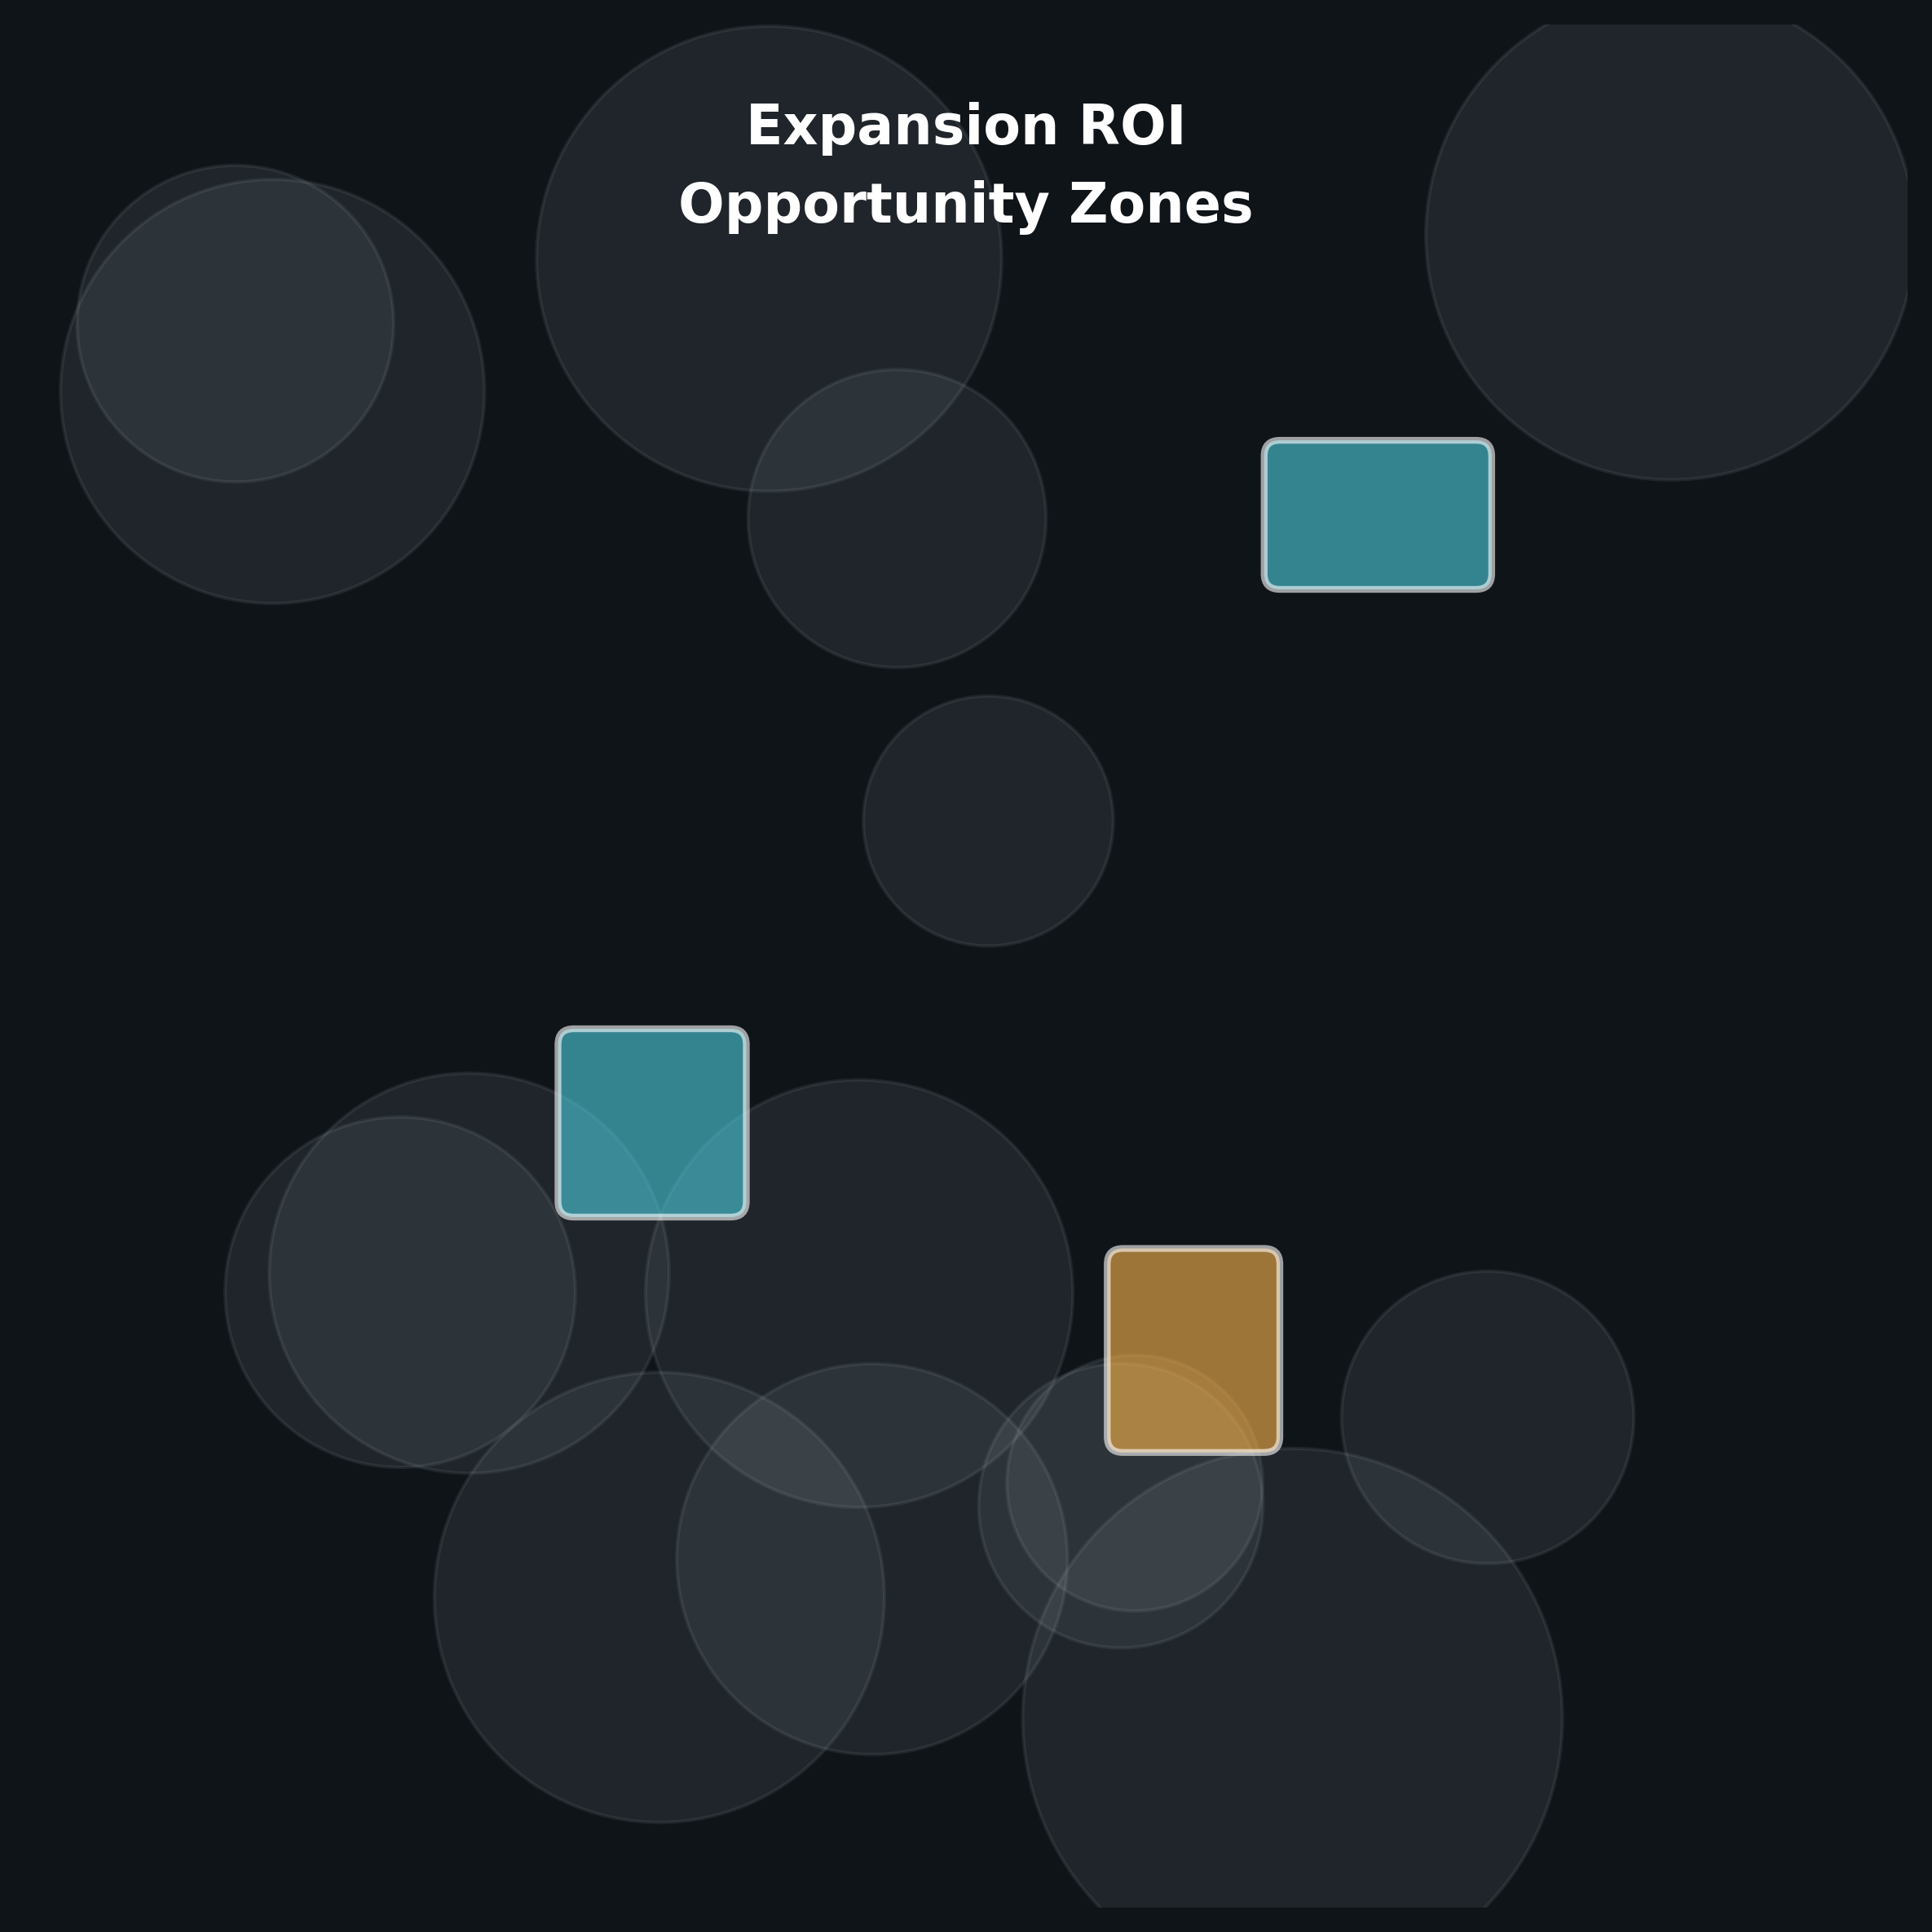
Capital Investment Strategy
Developed opportunity zone analysis highlighting strategic investment areas across both parks. This framework helped leadership evaluate trade-offs between different expansion options.
The final capital plan informed decisions on new hotels, land expansions, and high-capacity attractions that would support growth over the next five years.
My Hero Moment
A turning point in the project came when I helped automate the ride-throughput data pipeline. The parks had been relying on a manual process that made it difficult to analyze trends at scale or in a timely way.
By working with a programming consultant to automate the data import, we unlocked rapid access to a full year of performance metrics in a single day. That breakthrough made it possible to build the dashboards, forecasts, and insights that ultimately shaped the parks' multi-year capital strategy.
What This Project Taught Me
This project taught me how powerful data can be in shaping creative and operational strategy. I learned how throughput, guest flow, and downtime trends reveal the story of both guest experience and park performance.
More importantly, I saw how data can bridge creative goals and business needs. By translating raw numbers into insights, I helped leadership understand when to expand, where to invest, and how to plan for growth.
It showed me that great themed experiences rely on imagination, operational discipline, and the systems that connect them.